Saturday, December 13, 2008

SSAS Cube Testing

1.1 BVT / Smoke Testing Scenarios:

1. Ensure only the user with the desired permission is able to connect to the cube

2. Validate Data Source Connection string for cube

E.g. Provider=SQLOLEDB.1;Data Source=<Test ETL Server>.redmond.corp.microsoft.com;Integrated Security=SSPI;Initial Catalog=dbCPRMart

3. Validate your are able to successfully process the cube

4. Validate your are able to browse the cube

5. Configure and validating Analysis Services Query Logging

1.2 Data Validation Scenarios:

Approach 1: Browse the cube using BIDS or SQL Server Management Studio and compare the output against Mart using SQL query

If it’s a new development of a Cube, Browse the Cube, drag and drop measures on the Page and Dimension on the Y-axis. You need to write T-SQL that does similar aggregation that brings similar output.

Eg:

OWC Output:

                                 SALES        PROFIT

AP

      CHINA                 200                 60

      INDIA                   250                 50

US

      CHICAGO              500               65

       WASHINGTON      550               65

Equivalent T-SQL:

SELECT REGION, CITY, SUM(SALES ), SUM(PROFIT)  FROM GEOG G JOIN SALES  S FACT ON G.ID=S.ID

GROUP BY REGION, CITY ORDER BY 2

Approach 2: MDX query to compare data with SQL Query executed against Mart

2.1 For simpler Cube & Dimensional Models

Write your MDX query and compose SQL query for the same conditions and results should match

2.2 Automatically generate MDX using SQL Profiler & Reporting tools and compare it against SQL

SQL Profiler & Reporting Tools like PPS, ProClarity provide the capability of generating MDX on Cube conditions. Use these MDX against the SQL queries formed by you based on the relational / dimensional model on Mart.

Approach 3: Black box testing using sample test data

Insert / Update / Delete test data in your backend and calculate the outcome value based on the desired functionality / requirement without going to cube and ensuring that your expected output value matches the cube output in the final reports.

Approach 4: AMOMD object Compare

Create Automatic Verification Mechanism between OLAP and SQL objects

http://msdn.microsoft.com/en-us/library/cc281460.aspx

http://msdn.microsoft.com/en-us/library/cc280975.aspx

clip_image002

Figure: shows a high-level view of the AMO object model for OLAP objects

Reference:

http://microsoft.apress.com/feature/74/introduction-to-analysis-management-object-amo-programming

1.3 Cube Design Scenarios:

1. Validate all measures

  • Open Visual Studio analysis services DB
  • Browse and Open Cube DB
  • Double Cube and browse to "Measure" pane
  • Select measure <measure name>
  • Go to Properties, and check "source" field

     Expected Result:

  • Measure source should be set to correct table as source table and correct column as source column in Mart
  • Ensure measure has all the required fields / columns as present in the mart

2. Validate all dimensions & dimension hierarchies

  • Open Visual Studio analysis services DB
  • Browse and Open Cube DB
  • Double click Cube and open data source views and Open <Dimension name> Dimension under "Dimensions"

   Expected Result:

  • Make sure Table columns in Mart are mapped to Dimension correctly
  • Make sure Dimension key is correctly mapped to Dimension key column of the dimension Table in Mart
  • Make sure all the required columns / fields are present in dimension as present in mart
  • Ensure Hierarchy is correctly defined
  • Fiscal Year -> Fiscal Month -> Fiscal Week -> Calendar date

3. Validate all calculated measures

  • Open Visual Studio analysis services DB
  • Browse and Open Cube and go to "Calculated" tab
  • Check expression for "Calculated measure name"

    Expected Result

    The MDX expression defined should be accurate as per your requirements.

     Eg. [Measures].[ChangePoint Total Backlog] + [Measures].[Siebel High Pipe] + [Measures].[Siebel Low Pipe]

4. Validate “Data Source Views” of your cube against your design

image


1.4 Security Testing Scenarios:

1. Ensure each user belonging to a cube role has appropriate access

clip_image002[5]

2. User with read permission should only have access to browse the cube

Read Definition checkbox should be selected

clip_image004[6]

3. User with Process permission should be able to process the cube as well.

Process Database checkbox should be selected

4. User with Admin permission should be able to browse, process, make changes to the cube as well.

Full control (Administrator) checkbox should be selected

5. Cube roles should be mapped to correct users and group

clip_image006[4]

6. Cube roles should be having restricted access or unlimited access to dimension data based on the design and project needs

clip_image008[4]

1.5 Miscellaneous Scenarios:

1. Backup and Restore:

Take the backup of the cube and try restoring. The functionality should remain working as earlier.

1.6 Performance Scenarios:

1. Optimize Cube Aggregations

Before running your stress tests, you’ll want to ensure that you OLAP design has optimized aggregations. To optimize your aggregations, you’ll need to first turn on SQL Server Analysis Services query logging, then run the cube optimization wizard.

2. Using load simulator

Wednesday, November 12, 2008

Reduce number of invalid defects -> Improve Test Productivity and Efficiency & Let your Developers be happy

Just the other day we were discussing that how can we (testing team) reduce number of invalid defects. I was in deep thinking that why is it really important to reduce  the number of invalid defects.

    • Isn't it a tester's fundamental job to log every potential defect and let it go through normal defect life cycle and let business and management take call if it is a valid defect or not?
    • Isn't it right that tester shouldn't assume that it is not a bug and then regret later because of  a false assumption made?
    • Isn't a tester taught to think negative and always be suspicious and uncover what is not seen by someone like dev?


The point here is what is a big fuss if testing team raises 'invalid' defects unknowingly. At least they don't leave anything to assumptions which is far more dangerous. There primary job is to find defects, whether that is a 'valid' defect or not is a secondary question.

One of the tester I am mentoring complained that his testing team had found 108 defects out of which 104  were valid and only 4 were invalid but his management didn't seem to appreciate them for the the number of valid defects found as they were expecting number of invalid defects to be zero.

My take on this:

Yes, it is important to reduce number of invalid defects.

Why?

-> Test Metrics gets screwed (Test Effectiveness or lets say Test Productivity goes down with no. of invalid defects)

            Test Effectiveness = No .of Valid defect  / (No. of Valid Defects + No of invalid Defects) X 100 %

            Example for above:  104  / (104 + 4) X 100 % = ~96.6 %

-> Time lost in tracking and logging invalid bug

When you raise a bug in your reporting tool like Test Director, it has to go through complete bug lifecycle. Say you raised a bug spending effort in recording it and then it turned out to be invalid, you developer rejects it.  Finally you have to close it.

-> Management don't like invalid bugs

You bet me that "invalid" bugs doesn't please any manager. It is a human behavior to criticize something that is not right.  It sets them off.

-> Developers stop taking you seriously

When they observe that you raise many invalid bugs, they start expecting that every time. They stop paying due attention to valid bugs considering them to be invalid. Quality over Quantity concept.

-> Time lost in triage meeting to discuss invalid bugs

When you log invalid bug, it not only your time getting lost, developers waste their time reading them, then testers and developers waste time arguing on that as it has been officially logged, and most importantly business waste their time in triage meeting to take call.

-> Spoiling terms with development team

Developers are under pressure to reduce number of defect found in their code by the test team. Now if you log it, they go defensive and try their best to prove your bug an invalid bug so that it doesn't spoil their commitments.


Now that we have a problem. Let me propose something which we successfully implemented


defect _review_cycle


Now with this process, every bugs gets verified online by the Development team even before we officially log it. They update the sheet saying that they are okay with so and so bugs and we log only those bugs in the Bug Management tool  and hence all "VALID" bugs.

Bugs which they update as "INVALID" or "REJECTED", we update the SHARED SHEET with more information like repro steps etc and they change the status in the sheet accordingly. Now if it was our fault and it was actually INVALID defect, we update the SHEET and close it there itself rather than logging it in bug management tool and going through the entire process.

Now our metrics always say  100 % valid bugs. We don't miss any bugs because we record it anyway in the Shared Sheet and triage it with development team online. Development team feels good as they get a chance to to repro bug and confirm before it is actually logged against them.  We don't have to waste time in the triage meetings discussing whether its a bug or not. Now business only take call on functional bugs which are more important to end user.

Wednesday, November 5, 2008

Butterfly Effect in Software Testing (its happening all the time, did you ever notice)

"Small variation in the initial condition of a dynamic system may produce large variation in the long term behavior of the system"

Example: The phrase refers to the idea that a butterfly's wings might create tiny changes in the atmosphere that may ultimately alter the path of a tornado or delay, accelerate or even prevent the occurrence of a tornado in a certain location.

and for we guys "Small variation in the initial  requirement of a dynamic application / product / system may produce large defects in the long term usage of the system"

Example: A tiny misinterpretation or misrepresentation of a customer expectation in the form of requirement can ultimately impact the analysis, design and code, testing in such a way that it might result in a product failure or in worst case business failure sometime

here tiny change in requirement can be compared with butterfly's flapping of wings and because this change was not detected in the requirement stage and it keeps on passing through analysis, design and coding phase and finally gets so much amplified that the impact becomes a huge loss to the business.


One of my friend had been asked in an interview "what is Domino effect in software testing?"  He didn't know and hence couldn't answer.

It is again related to Butterfly effect and Chaos theory that a small change anywhere in the system (requirement, analysis, design, code, testing) can cause a similar change nearby and that will another similar change and so on in a linear sequence.

Example: A wrong change in requirement -> similar change in analysis to accommodate that -> similar change in design for that analysis-> similar change in code for that analysis -> similar change in test cases for that requirement and so on.

800px-Toppledominos


Interesting fact: The term is best known as a mechanical effect, and is used as an analogy to a falling row of dominoes.

Saturday, November 1, 2008

Resurrecting the Prodigal Son – Data Quality (Presented at Test2008)

Saga of Unsung Heroes (A tribute to all testers in this world)

Conference Trip Report Test 2008 – New Delhi, India

On Oct 15th and 16th, I attended the Test 2008 conference in New Delhi, India. Test2008 is the first international test conference being organized by Pure Conferences in India. It had speakers from around 10 countries and the theme of the conference was “agility in testing”. Conference was primary organized by Vipul Koacher who is the head of Indian Testing Board and also the founder of Pure Conferences.

IMO, the key take away from the conference were the two animated panel discussions on “Agile Testing– Support Vs Against” and “Schools of Testing – Good or Bad”. In first panel discussion, the distinguished panel members had mixed reaction to the question “Is the agile development the way to go in future?” . William Rollison (BJ) gave a great example of successful agile testing happening at Microsoft in OfficeLab team

But the key message is that Agile testing is a great thing but it can’t replace other approaches and techniques especially in life and mission critical applications like aviation. When one panel member asked “How many of us would want to travel by an aircraft which is agile tested?”, everybody got the point made.

Another panel discussion on much blogged and talked about various “Schools of Testing” like Context-Driven school of testing, Analytic School, Standard School, Quality School & Agile School, promoted by many leading test practitioners like James Bach and Michael Bolton became quite intense. Famous test practitioner Rex Black and BJ made it very clear that they don’t support any such schools of testing and it is really unfair to create a rift in the testing industry by creating these mutually exclusive buckets and emphasized that the software testers should continue to use whichever good test techniques and approaches are available irrespective of which school they belong to.

Like most of the conferences there were three parallel tracks for audiences to choose from. “Interactive Bug Hunt” by Klaus Olsen was very popular among the attendees as it had 20 minutes hands on to find maximum bugs by forming small teams and ringing bell every time a new bug is discovered. “Building a fuzzing framework for software testers” by Rahul Verma from McAfee was a technical presentation on various security testing techniques and approaches.

There were couple on presentations made by Microsoft India products team on the role of “Virtualization” for agile development (Vinod Malhotra) and “Breaking the dev/test barrier” using Visual Studio Team System 2010 by Tanuj Vohra, Partners Director PM, Visual Studio Team, which were very well taken by the audience. This is the first test conference I have attended where Microsoft’s presence and dominance in software test industry was clearly visible.

I had the opportunity to present a paper with my co-speaker Bhoomika Goyal on “Resurrecting the Prodigal Son – Data Quality” which went quite well. We have received compliments from many attendees for choosing this relatively newer topic at the software test conference. Many participants agreed that Data Quality testing is an industry wide problem with very high impact but it has still remained ignored for a very long time and now the trends (investment made in Data Profiling, Data governance by industry leaders) show that having good data quality is extremely important for making accurate and timely decisions which is the most critical factor for the success of our customers. We presented a case study on DQ Test Automation Framework from our actual learning at Microsoft Business Intelligence COE, India.

Finally, this conference had quite a few sessions on Agile testing which gave me a new insight on how it is practiced industry-wide and how we can leverage that better at work.

Resurrecting the Prodigal Son – Data Quality “Rise from the Ashes: Battle of Data Quality Testing”

Authors:

Raj Kamal

Microsoft India (R&D) Private Limited,

Microsoft Campus,

India

rajkamal@microsoft.com

Bhoomika Goyal

Microsoft India (R&D) Private Limited,

Microsoft Campus,

India

Goyal.Bhoomika@microsoft.com

Abstract:

There is perhaps no other activity that is as much a bane of our existence in decision making as “reconciling” data. Data quality testing is a sea with a few large fish (data integrity, data consistency, data accuracy, redundancy-related issues etc.) and many minnows.

Every firm, if it looks hard enough, can uncover a host of costs and missed opportunities caused by inaccurate or incomplete data. This is where Data Quality Testing pitches in and can be instrumental in helping businesses achieve their true potential by reaping the benefits of the timely availability of high quality of data.

After all, who would like to buy yellow pages which contain outdated contact numbers or fly on an airplane that does not conduct preflight checks?

Our mission is to provide information about the costs that testing teams incur due to the lack of data quality testing versus the benefits of taking the actions we propose in this paper.

We would like to answer some important questions which might already be popping into your mind, such as “What is DQ Testing?” If it exists, “What’s wrong with the current approach?”, “What’s new in this paper?”, “What is there in it for me?” and “Where and how can I apply it?”

The objective is to share the key lessons regarding the importance of DQ Testing and present a step-by-step generic test strategy which will help the testers and test managers adopt and apply it when they go back to work, and enjoy the benefits.

As data quality is a strategic IT initiative which involves a strong commitment and a huge investment from management, including a steering committee, we will keep the scope of this paper restricted to the contribution the test team can make – an initiative to significantly improve the data quality by incorporating DQ in the testing process which will help your organization by detecting possible DQ issues earlier than your customer reports it.

The unique, yet simple, approach suggested here is to have an automated metadata-driven approach to continuously monitor the health of the application by automating DQ checks which will provide the test team and users with a DQ summary report containing DQ test metrics.

This will create a win-win situation for the testing staff and your enterprise where the testing team can earn the well-deserved credit for improving the DQ of the application by using an effective testing approach and helping the users of the application feel confident of the data health while making critical business decisions.

1 Introduction:

Data Quality: Data are of high quality "if they are fit for their intended uses in operations, decision making and planning" (J.M. Juran).

Poor data quality can seriously hinder or damage the efficiency and effectiveness of organizations and businesses. If not identified and corrected early on, defective data can contaminate all downstream systems and information assets. The growing awareness of such repercussions has led to major public initiatives like the “Data Quality Act” in the USA and the “European 2003/98” directive of the European Parliament. Enterprises must present data that meet very stringent data quality levels, especially in the light of recent compliance regulations standards.

2 Fable:

The task at hand is to test a large data warehouse and CRM implementation of a global bank which has a huge volume of transactional data (on the scale of terabytes) scattered among various disparate sources in different formats like flat files, DB2, Oracle, SQL server, MS Access, Excel etc. To make things even more complex, a medium-sized regional bank is acquired and merged which brings in additional gigabytes of data such as customer information, loan information, account details etc.

The test team faces the challenge of ensuring the quality of the data which is as complex as the data for a subject area, since a customer might be stored in more than one source in different formats and the underlying business rules vary among the systems. The integration and transformation of data performed by the development team has a higher probability of missing significant data, duplicating existing data and introducing latencies, inconsistencies and inaccuracies into the system.

The experienced test team manually verifies and validates the integrated data showing up in the reports coming out of data warehouse against the business rules. Few test cases are written to test the sample data flow from sources to data warehouse to reports and the test team certifies the application.

A couple of days after the production release, the customer comes back with a list of DQ issues, for example they can’t find some important data or some of the data is repeated multiple times in the drop-downs and the KPI (key performance indicators) are showing incorrect results. Later it is discovered that there are flaws in the transformation and integration logic and data was missed, duplicated and incorrectly manipulated resulting in many DQ issues.

Finally the customer rejects the application and goes back to manual reporting based on the legacy application and the IT team starts working on fixing and testing the DQ issues which could have been avoided by a focused DQ test approach for testing various dimensions of data qualities.

3 DQ Testing Problems / Sore Points:

DQ Testing has always been given less importance than it deserves, and for more than one reason.

3.1 DQ Requirements are “missed” in the Functional Specifications

Typically, DQ Requirements (DQ Definitions, Scope, Acceptance Criteria, Measurement criteria) are not covered in the Functional Specs and are not explicitly articulated by the business.

clip_image002

Fig. 1: Ishikawa Diagram

3.2 White box Testing / Technical knowledge is required

The testing team is often expected to perform black-box testing or functional testing based alone on the functional specifications given by the business. It was often assumed that the underlying architecture and the design (which also includes processing, transformation as well as flow of data) fall under the development team’s responsibility and have to be tested by developers during unit testing.

3.3 Management overconfidence on quality of their data

It was often the case that management felt that their data couldn’t have inconsistencies or inaccuracies and that activities like data integration can’t impact the overall quality of data.

3.4 Complexity grows with CRM / ERP Implementations & Mergers / Acquisitions

In the last decade, as a result of globalization along with the worldwide CRM and ERP implementations trend and strategic decisions like mergers/acquisitions, data integrations has become a bigger challenge for testers due to the exponential increase in the complexity of data.

Testing Data warehousing, CRM and e-business projects often involves testing poor quality data because they require companies to extract and integrate data from multiple operational systems. Data that is sufficient to run individual operations is often riddled with errors, missing values and integrity problems that do not show up until someone tries to summarize or aggregate the data.

3.5 Dynamic nature of the data which quickly becomes obsolete over time

Experts say that 2% of the records in a customer file become obsolete in a month because customers die or divorce, marry and move. In addition, data-entry errors, system migrations, system integrations and changes to source systems, among other things, generate numerous errors such as inconsistencies, inaccuracies, latencies etc.

4 DQ Adoption Guide

If your project falls under any of the categories shown in the diagram below then you enter the realm of DQ Testing. Basically whenever data is created, modified, integrated or processed from one form to another, there is a probability of introducing DQ issues and hence DQ testing is a must.

clip_image004

Fig. 2: Project Categories

5 DQ Test Strategy:

Data Quality Testing is the process of verifying the reliability and effectiveness of data. Maintaining data quality requires monitoring the data periodically and reporting it as early as possible. DQ Test Strategy should be prepared during the requirement analysis phase as it is important to define and measure DQ requirements which are expected by the customer.

DQ Testing can be done in a “Preventive” as well as “Reactive” manner. Focusing on DQ from the envisioning phase ensures that DQ issues are prevented by means of verification/static testing. As explained in Section 5 below, a Reactive approach has been developed which can identify the DQ issues that have crept into the system by monitoring the DQ health on a continuous basis.

clip_image006

Fig. 3: DQ Strategy

5.1 Test Prioritization (Kano Analysis):

This approach suggests prioritizing the performance of DQ checks depending on their importance to the customer which results in increased performance and satisfaction.

clip_image008

Fig. 4: Kano Analysis

As shown in the Kano analysis in the figure above, the DQ Dimensions/Audits are classified in terms of the following categories:

Must be’s (Expected Quality):

The highest test priorities should be given to the typical DQ checks shown in the figure above as these are the basic explicit customer requirements

One Dimensional (Desired Quality):

The next important requirements are the DQ checks like Timeliness, Availability etc. as these are most often the promised requirements.

Delighters (Excited Quality):

DQ checks which are not requested by the customer but which can increase the satisfaction by meeting these implicit requirements.

5.2 DQ Testing Approach

The involvement of the testing team starts right from the requirements phase and continues throughout the life span of the project. The test team has to ensure that DQ is appropriately defined and the measurement criteria are included in the requirement document along with the threshold and acceptance criteria defined by the business for each DQ check.

clip_image010

Fig. 5: DQ LifeCycle

DQ Test Planning:

· Define Data Quality test approach & the scope of testing by taking inputs from the business.

· Decide on the test metrics to monitor & measure DQ.

DQ Test Design:

· Create DQ Test Scenarios with the expected test results (refer to Section 6 below).

· Have it reviewed by the business and against the threshold values for each DQ check.

· Prepare DQ Metadata from Data dictionary, Business Rules from FS and Input from Business.

DQ Test Execution & Reporting: (refer to Figure under Section 5)

· Automate DQ test scenarios for checks which can be scheduled to run for the DQ metadata over a period of time.

· Log the DQ test scenarios result (manual/automation) and report DQ discrepancies to the users.

DQ Test Monitoring:

· Run DQ Test scenarios on a scheduled basis to continuously monitor the health of the applications.

· Send the automated reports/notifications to the users with the discrepancy summary of the DQ Test Metrics (refer to Section 7) which are violating the defined threshold during planning.

6 DQ Test Implementation / Solution:

To ensure information quality, the test team has to address it from the very beginning. The test team is required to define data quality in a broad sense by taking inputs from the business, establish metrics to monitor and measure it, and determine what should be done if the data fails to meet these metrics. Data quality issues need to be detected as early in the process as possible and dealt with as defined in the business requirements.

DQ Inputs:

· Metadata: contains list of server name, database name, table names, and column name against which DQ checks need to be performed.

· Business Rules: contain the functional logic and formulas which are used to process and transform the data.

· Thresholds: the values which define the valid range or accepted deviation for various DQ Metrics.

DQ Engine:

· Automated Scripts for DQ Checks: These can be your SQL code to validate consistency, accuracy, validity, row count etc. against the metadata which is keyed as input.

· Discrepancy/Results Tables: Automation scripts log the discrepancies in these tables by comparing the output against the discrepancies based on the threshold defined.

· Scheduling for DQ Checks to run: Automation scripts are run in an “unattended” mode on a continuous basis to track the DQ health of the application over a period of time.

DQ Output:

· DQ Discrepancy Summary Reports with Metrics: Based on the template defined, DQ metrics are calculated from the discrepancies logged by the DQ Engine and reported to customers and management in the form of DQ Notifications/e-mails.

· DQ Issues/Bugs: DQ issues like application bugs are triaged with the development team and the customers and pass through the typical defect lifecycle.

DQ Feedback & Continuous Process Improvement:-

· DQ Automatic Feedback & Continuous Improvement: The IT team along with the business decides the corrective actions and the priority.

Some of the corrective actions can be:

o Fixing the code to rectify the DQ issue

o Change in requirement or functional spec if it was a functional DQ issue

o Change in design, architecture if it was an environment or performance related issue

Following are the important “DQ Components” which can be automated by the test team to make the DQ test monitoring a continuous process:

clip_image012

Fig. 6: DQ Implementation

7 DQ Test Scenarios:

clip_image014

Fig. 7: DQ Checks

7.1 Row Counts: clip_image015

Count of records at Source and Target should be the same at a given point of time.

clip_image017

Fig. 8: Row Count Example

7.2 Completeness: clip_image015[1]

All the data under consideration at the Source and Target should be the same at a given point of time satisfying the business rules.

clip_image019

Fig 9: Completeness Check

7.3 Consistency: clip_image015[2]

This ensures that each user observes a consistent view of the data, including changes made by transactions. There is data inconsistency between the Source & Target if the same data is stored in different formats or contains different values in different places.

clip_image021

Fig 10: Consistency Check Example

There is a need for tools that can handle international data differences, that require such features as support for Unicode and rules engines that can deliver local address validation and other functions across multiple languages and formats.

clip_image023

Fig 11: Consistency Check Example #2

7.4 Validity: clip_image015[3]

Validity refers to the correctness and reasonableness of data. A valid measure must be reliable, but a reliable measure need not be valid.

Questions:

-> Is the information reliable?

-> How is the information measured?

Fact: A large bank discovered that 62% of its home-equity loans were being calculated incorrectly, with the principal getting larger each month.

clip_image025

Fig 12: Validity Check

7.5 Redundancy/Duplicates Detection: clip_image027

Consider what happens when a single customer is included in a company's database multiple times, each time with a different value for the customer identifier. In such a case, your company would be unable to determine the true volume of this customer's purchase. You could even be placed in the embarrassing situation of attempting to sell the customer an item that the customer has already purchased from you.

Physical Duplicates: All the column values repeating for at least 2 records in a table.

Logical Duplicates: Business Key (list of column) values are repeating for at least 2 records in a table.

clip_image029

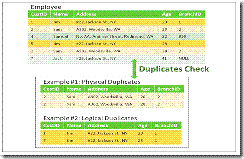
Fig 13: Duplicates Check

7.6 Referential Integrity: clip_image026

If there are child records for which there are no corresponding parent records then they are called “Orphan Records”. Logical relationship rules between parent & child tables should be defined by the business.

clip_image031

Fig 14: Referential Integrity Check

7.7 Domain Integrity: clip_image015[4]

clip_image033

Fig 15: Domain Integrity Check

clip_image035

Fig 16: Domain Integrity Check

7.8 Accuracy: clip_image015[5]

clip_image037

Fig 17: Accuracy Check

7.9 Usability: clip_image026[1]

clip_image039

Fig 18: Usability Check

7.10 Timeliness clip_image040

clip_image042

Fig 19: Timeliness Check

8 Key DQ Test Metrics:

Data Quality metrics, which helps in quantifying the quality of data over different dimensions, can be derived on a scheduled basis from the DQ Test Scenarios execution or result logs for various DQ checks manually/automatically by having a DQ test implementation in place (similar to the one proposed above)

clip_image044

Fig 20: DQ Test Metrics

These DQ metrics are critical so that management may determine the DQ health of the integrated system. Depending on the project needs and the criticality, the frequency of calculating and reporting these metrics can be determined.

9 Conclusion:

It is critical to measure the effectiveness of the test strategy as it is the key to “continuous process improvement”. We will talk about this in detail in our next white paper. Stay tuned.

Today we have introduced many DQ test problems and recommended a test strategy to tackle them. We can assure you that the complexity and the scope of data quality testing in large enterprises are difficult for a layman to understand. Most test teams do not prepare or adopt a dedicated test strategy to build quality into their data in a proactive, systematic and sustained manner. Many potential DQ issues can be avoided by implementing the proposed DQ Test strategy as part of the overall test process. It is often not until you discover a major problem in production that could have been avoided through quality control of your data that you recognize the importance of data quality. As a consequence, the business may lose revenue, opportunities, even customers, and in the worst case can even get sued.

Don’t end up like them. Be different. Always remember to put quality first.

9. References:

[1] The Kano Analysis: Customer Needs Are Ever Changing by J. DeLayne Stroud

http://finance.isixsigma.com/library/content/c071017a.asp

[2] Be Prepared to Duel with Data Quality – Rick Sherman

http://www.athena-solutions.com/bi-brief/2006/jan06-issue24.html

[3] Trends in Data Quality – Lou Agosta

http://www.dmreview.com/issues/20050201/1018111-1.html

[4] Gartner ranks data quality management software, reveals trends - Hannah Smalltree

http://searchdatamanagement.techtarget.com/news/article/0,289142,sid91_gci1263861,00.html

[5] Data Warehousing Special Report: Data quality and the bottom line -Wayne W. Eckerson

http://www.adtmag.com/article.aspx?id=6321&page=

[6] The Importance of Quality Control: How Good Is Your Data? - Andrew Greenyer

http://www.customerthink.com/article/importance_quality_control_how_good_data

[7] Garbage In, Garbage out: The Importance of quality ideas – Jennifer Hanson

http://www.fastcompany.com/blog-post/garbage-garbage-out-importance-quality-ideas

10. Authors:

clip_image046

Raj is a Test consultant specializing in different types of testing techniques, test automation and testability in different domains like Manufacturing, Healthcare and Higher Education. He holds an APICS certification in Supply Chain Management. Expertise with Rational and Mercury testing tools, he has helped teams develop test automation strategies and architectures for such companies as Cognizant Technology Solutions and Oracle Corporation. He also provides training in automated testing architectures and design. He is QAI (CSTE) & ISTQB Certified. He has a master's degree in Computer Applications. He is currently working at Microsoft, India, Business Intelligence COE. He has earlier represented Microsoft and Oracle at International test conferences as a Speaker.

His Blog (http://www.itest.co.nr/ )

clip_image048

Bhoomika has been working with Microsoft for more than a year now as a part of the APEX program. She has completed her first two rotations in Development and Test discipline. Has done her B.E. – Information Technology from Vivekanand Education Society’s Institute of Technology, Chembur, Mumbai. She has mainly worked in technologies like C, C++, Visual Basic, Java, SQL Server, ASP.NET, C# and SharePoint. Her hobbies include Playing Chess, Solving Puzzles and Reading.

Resurrecting the Prodigal Son – Data Quality (Test 2008 International Conference)

http://www.slideshare.net/raj.kamal13/test2008-resurrecting-the-prodigal-son-data-quality-share-presentation

Saturday, February 23, 2008

This is Bugs Story

Million Dollar Question - 20 % Brand new test cases ?

When is the last time you wrote a test case or  a scenario which you had never written before?

When is the last time you came across a scenario you had never thought in your testing career?


If % of above scenarios (for a given project) is not more than 20 % then:

  • You are not adding value to the customer by rewriting the old stuff.
  • You are not realizing your true potential.
  • You are reinventing the wheel

While doing test case creation, 80 % of times we write  fewer than 20 % brand new test cases or scenarios (not trying to fit in pareto just because it looks cool)


I know by now you must have understood where am i coming from and you have would have possibly concluded that it is something not new what I am going to tell you.

But if I don't tell  what I am going to tell you then there is no ways that you can find out what am I going to tell you:) so read on.


I promise you that two words I am not going to use in this post are "reuse" and "library", doesn't how much I will be successful because will be tempted to use them.

Reason: Reuse and Library are two most abused words not just in testing industry but IT as a whole.

Disclaimer: Author is not saying that he doesn't believe in reuse and library, its it just that we want to look at the true meaning of the words without using them.


Technique:

Next time  you get an assignment of writing test cases, ensure following things:

First Step: TC Creation

1. Your test case / scenario contains two different logical sections - Generic Vs Application Specific.

2. Generic section should be written in plain English considering what that test case means to someone in real world generic step of execution and expected outcome for those

3. Application Specific section should contain details specific about your application only like exact steps, exact expected result, test data

4. Add a field specifying the "Area" - Web Application (.Net/ Java etc)  / Desktop application / Database Application / ERP etc

5. Go through the complete cycle and keep on refining you Generic and Application specific areas.

Effort: (120 %: 100 % (Application specific sections) + 20 % (Generic sections) )

Second Step: Central Repository formulation

1. Pick only logical generic sections from the above set and classify them with different areas.

2. Spread this to other fellow testers and team.

3. Each times someone add any test case / scenario to this repository then  quickly look for duplicates:

a) If duplicate, then merge both the test cases to have an enhanced test case.

b) If not duplicate,  then make an entry into the repository.

Additional Effort: (20 % - Identifying duplicates and upgrade of repository)

Third Step: Think Hard  - Test Case Creation

1. Now for this project (similar to above) ensure the following:

a) Take the generic test cases from the repository based on the "Area" filter.

b) Work on expanding the generic test cases

c) Now ensure that you think of at least 20 %  new scenarios which are not present in the repository.

d) Go through the cycle and keep refining step b and c

Effort: ( Iteration 1: 80 %, Iteration 2: 60 %, Iteration 3: 40 %)

Fourth and Final Step: Paying back to the community

1. From Third Step, 1 (b), update the central repository to make the test cases more generic

2. From Third Step, 1 (c), add the test cases to the repository.

Additional Effort: (20 %, identifying duplicate and upgrade of repository)

Saturation Point:

After following Step 2,3 and 4 continuously over a period of time, you will reach a state of high TCM (Test Case Maturity) when it will start becoming identifying new scenarios and the effort will continue to go down and you get ROI of the work.

One man initiative:

It can be started by one man but can't be accomplished without strong management support and contribution from the community.


Million Dollar Question: Is it always possible to write 20 %  brand new scenario's  for every project which were not covered in past for a similar project?

Answer:

Scenario 1: If you haven't followed the above practice then yes have a very high chances of writing more than 20 % brand new scenarios very easily for a similar project.

Scenario 2:If you have followed the practices described above by author over a period of time (>3 Iterations) then the possibility of finding another set of 20 % brand new scenarios will become difficult and difficult with every iteration. And one day,you even after applying all your imagination / thinking and even after covering all the requirements, you wont be able to find 20 % more brand new scenarios and that is when you have reached saturation point.


Note: The more the difficultly in identifying brand new scenarios, the more (higher) is your requirement coverage and test case maturity.


New Testing term coined: Test Case Maturity

You must have heard of CMM levels which define the maturity of an organization's process. TCM is a term which defines the maturity of your test case.

Each time you write a test case , it has certain maturity associated with it which can be calculated by using the


1. Is the test case covering a most obvious requirement?   - Level 0

2. Is test covering the very high level requirement ?  - Level 1

3. Is the test case was already written by past and can be used as it is ?  Level 2

4. Is it test case written in past can be re-adopted and can be customized for your project?  Level 3

5. Is the test case can re-adopted and extended and made generic for other projects too ? Level 4

6. Is your test was a not present in repository and can be added to the central repository for other to adopt ? Level 5

7. Did your test case cover any unique aspect which can impact the existing test cases in central repository ?  Level 6


Benefits:

1. Value addition to customer

2. Lesser effort required, lesser cost (> 3 Iterations, not overnight :) )

3. Challenging task for testers, keep them 'thinking'

4. Contributing to the community as a whole

5. Able to get time to think of scenarios and find bugs which never got time for.

6. Standardization of test case across community.

7. Easy for new comers, end users to execute and perform testing.

8. More accurate effort estimation.


Ending note:

Saturation point doesn't mean "stop there", but it means that you got to find our other ways to take this to the new level.

Example: You can dissolve 2 teaspoon of sugar in a cup of water in a matter of 20 secs,

another teaspoon of sugar, may be 30 secs, one more teaspoon , its becoming difficult.

just one more tea spoon, not it doesn't work . Is that is what we call a saturation point?


Thinking: The saturation point is different at different temperatures. The higher the temperature, the more sugar that can be held in solution.

So that's not the end, you can heat the sugar solution and it can hold more amount of sugar so keep trying.

But infinite amount of sugar, may be no.


BTW, did you do a CTRL + F to verify that if I did  use the term "reuse" and "library" again :) 


Please feel free to write your comments !!!!  Contact: raj.kamal13@gmail.com

Sunday, February 17, 2008

Rational Requisite Pro - Requirement Management (Advanced Training)

Test Automation Change Control Process - Sounds Interesting?

This change control process is to ensure that in a "big" automation project whenre "Modular" Library architecture is followed, libraries are not mistakenly / intentionally changed by the automation testers and every change in the library goes through a well defined "Automation Workflow" depending upon the role and the access rights.

Changing libraries without this process can even cause the other automation scirpts to fail or having a possibility of redundant code being written for same functionality which is often the reason for automation failure.

Thought of depicting this process graphically so that everyone here can understand this process.


Library Change Control Process


Performance Testing - VU Scripting using IBM Rational Robot & Test Manager

Rational Robot - Training

Priortizing Test Activities - A Presentation

Advanced Rational Robot - A Tribute